The housing market in the European Union has become a focal point for decision-makers, economic analysts, and residents. In this article we will take a closer look at the latest data from Eurostat, covering the first quarter of 2024, to provide a comprehensive overview of house prices and rental trends across EU member states. By examining quarterly and annual growth rates and long-term trends dating back to 2010, we aim to paint a clear picture of the evolving housing landscape in Europe. This analysis is crucial for understanding the broader economic health of the EU, as housing costs significantly impact citizens’ quality of life and financial well-being. The disparities between countries and the divergence of house prices and rents over time offer valuable insights into the complex factors shaping the European housing market.
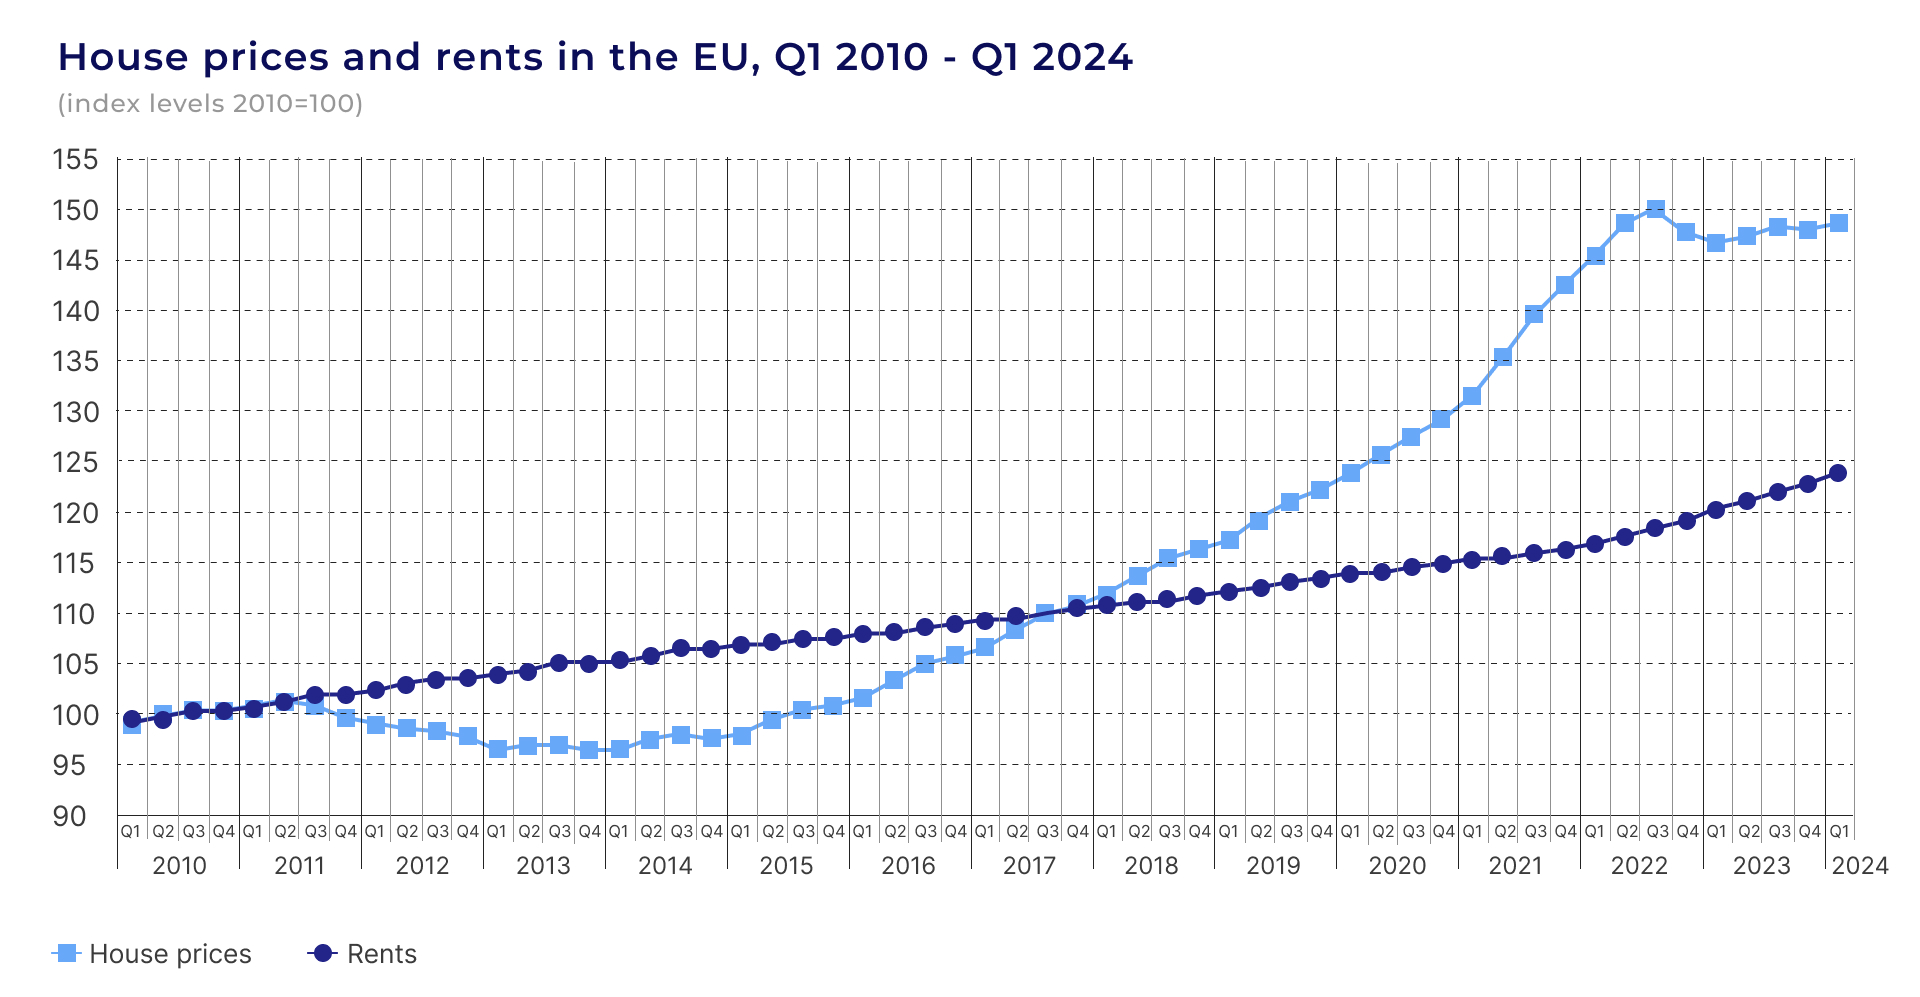
In the initial quarter of 2024, the European Union witnessed a modest increase in house prices, rising by 0.4%, while rents saw a slightly more pronounced growth of 0.9% compared to the preceding quarter of 2023. This recent data point is part of a larger narrative that has unfolded over the past decade and a half.
Historically, house prices and rents in the EU followed a remarkably similar trajectory between 2010 and the second quarter of 2011. However, these two indicators have embarked on divergent paths since that pivotal moment. Rents have demonstrated a steady and consistent upward trend, continuing their climb up to the second quarter of 2023. In contrast, house prices have exhibited a more volatile and unpredictable pattern, characterized by periods of decline interspersed with phases of rapid appreciation.

The housing market experienced a particularly tumultuous period between the second quarter of 2011 and the first quarter of 2013, during which house prices sharply declined. This was followed by a period of relative stability from 2013 to 2014. The landscape shifted dramatically again in early 2015, heralding the beginning of a rapid ascent in house prices. This upward momentum continued unabated, with house prices outpacing the rent growth until the third quarter of 2022.
The market dynamics took another turn in the fourth quarter of 2022, as house prices experienced a consecutive two-quarter decline. However, this downward trend was short-lived, with prices rebounding in the second and third quarters of 2023. The fourth quarter of 2023 saw a slight dip, followed by another uptick in the first quarter of 2024, underscoring the market’s ongoing volatility.
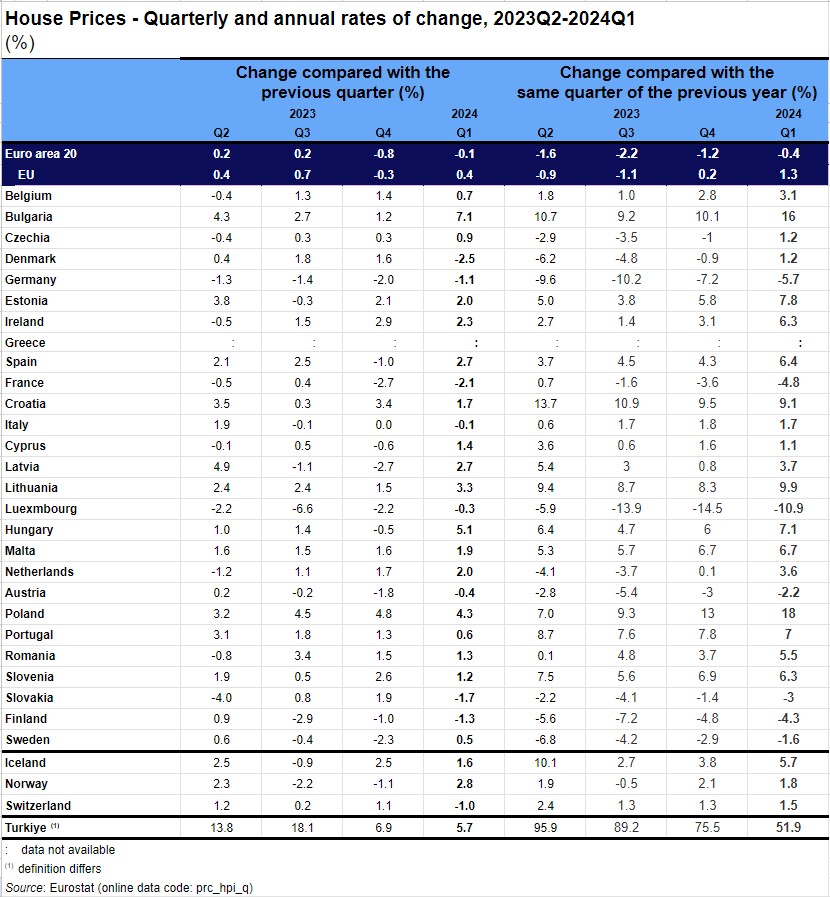
The granular analysis of individual Member States reveals a diverse range of outcomes. Of the countries where data is available, seven reported an annual decrease in house prices for the first quarter of 2024, while nineteen experienced a yearly increase. Luxembourg led the declines with a substantial 10.9% drop, followed by Germany at 5.7% and France at 4.8%. On the opposite end of the spectrum, Poland recorded the most significant increase at 18.0%, with Bulgaria and Lithuania following closely at 16.0% and 9.9% respectively.
Examining quarter-on-quarter changes provides further insight into short-term market movements. Eight Member States saw price decreases compared to the previous quarter, while eighteen experienced increases. Denmark registered the largest quarterly decline at 2.5%, with France and Slovakia also seeing notable drops of 2.1% and 1.7% respectively. Conversely, Bulgaria led the increases with a robust 7.1% rise, followed by Hungary at 5.1% and Poland at 4.3%.

The period from 2010 to 2014 was characterized by a decreasing trend in house prices relative to inflation within the euro area. This was reflected in negative annual rates of change, indicating that house prices either declined in absolute terms or increased at a rate lower than inflation.
The year 2015 marked a significant turning point, as house prices began to outpace inflation. This trend gained momentum between 2016 and 2021, with house prices consistently increasing between 3.0% and 5.5% more than inflation each year. The market showed signs of cooling in 2022, with house prices rising just marginally above inflation at 0.3%. The landscape shifted dramatically in 2023, as house prices decreased in the face of high inflation, resulting in a substantial 6.8% decline in the annual deflated house price.
It’s crucial to note that these broad trends mask significant variations among EU Member States. The period from 2016 to 2021 saw house prices outpacing inflation in 24 to 26 EU Member States annually. However, 2022 brought a change, with house prices lagging behind inflation in 10 EU Member States. The picture became even more diverse in 2023: house prices decreased in 10 EU Member States, increased less than inflation in another 10, and surpassed inflation in 6 Member States (Bulgaria, Greece, Croatia, Lithuania, Malta, and Portugal).
Taking a long-term perspective from 2010 to the first quarter of 2024, the EU has seen a cumulative increase of 23.9% in rents and a more substantial 48.7% rise in house prices. Focusing on the most recent annual change, the first quarter of 2024 saw rents increase by 3.0% and house prices by 1.3% compared to the same period in 2023. The quarterly changes for the first quarter of 2024 show a 0.9% increase in rents and a 0.4% rise in house prices compared to the fourth quarter of 2023.
The trajectory of house prices and rents in the EU followed a similar upward path between 2010 and the second quarter of 2011. However, after this point, the two indicators diverged significantly. While rents continued to increase steadily up to the second quarter of 2023, house prices exhibited a more erratic pattern, characterized by both decreases and periods of rapid growth.
Comparing the first quarter of 2024 with 2010, among the EU countries for which data are available, house prices increased more than rents in 20 countries. House prices more than doubled in Estonia (+223 %), Hungary (+207 %), Lithuania (+170 %), Latvia (+140%), Czechia (+125 %), Austria (+108 %) and Luxembourg (+101 %). Decreases were observed in Italy (-8 %) and Cyprus (-1.2 %).
Source: Eurostat (online data codes: prc_hpi_a, prc_hpi_q, prc_hicp_aind, prc_hicp_midx)
(1) Greece: data for house prices since 2010 not available, Bank of Greece data used to estimate the European aggregates.
(2) Switzerland: data for house prices since 2010 not available.
The analysis of EU housing market trends from 2010 to the first quarter of 2024 reveals a complex and dynamic landscape. While overall house prices in the EU have increased by 48.7% and rents by 23.9% since 2010, the journey has been far from uniform across member states. The data highlights significant disparities, with some countries experiencing more than a doubling of house prices, while others saw decreases. The divergence between house price and rent trajectories, particularly notable since 2011, underscores the multifaceted nature of housing market dynamics influenced by factors such as economic policies, demographic shifts, and investment patterns.
The recent trends, including the slight increase in house prices and rents in the first quarter of 2024, suggest a stabilizing market after periods of volatility. However, the varying rates of change across different EU countries indicate that local factors continue to play a crucial role in shaping individual housing markets.
This comprehensive overview emphasizes the need for nuanced, country-specific approaches to housing policy within the EU. As housing affordability remains a pressing issue for many European citizens, policymakers must consider these long-term trends and recent developments to craft effective strategies that address the diverse challenges faced by different member states. The ongoing monitoring and analysis of these trends will be essential for ensuring sustainable and equitable housing markets across the European Union in the years to come.